

The sessions list
Every session is listed newest first. Each row shows the opening message, when it ran, how many turns it took, and its total duration. Use the agent and time window filters at the top (the last 30 days by default) to narrow the list to recent activity or to a single agent. Runs started by a schedule appear here too, marked Scheduled run and showing the agent that ran.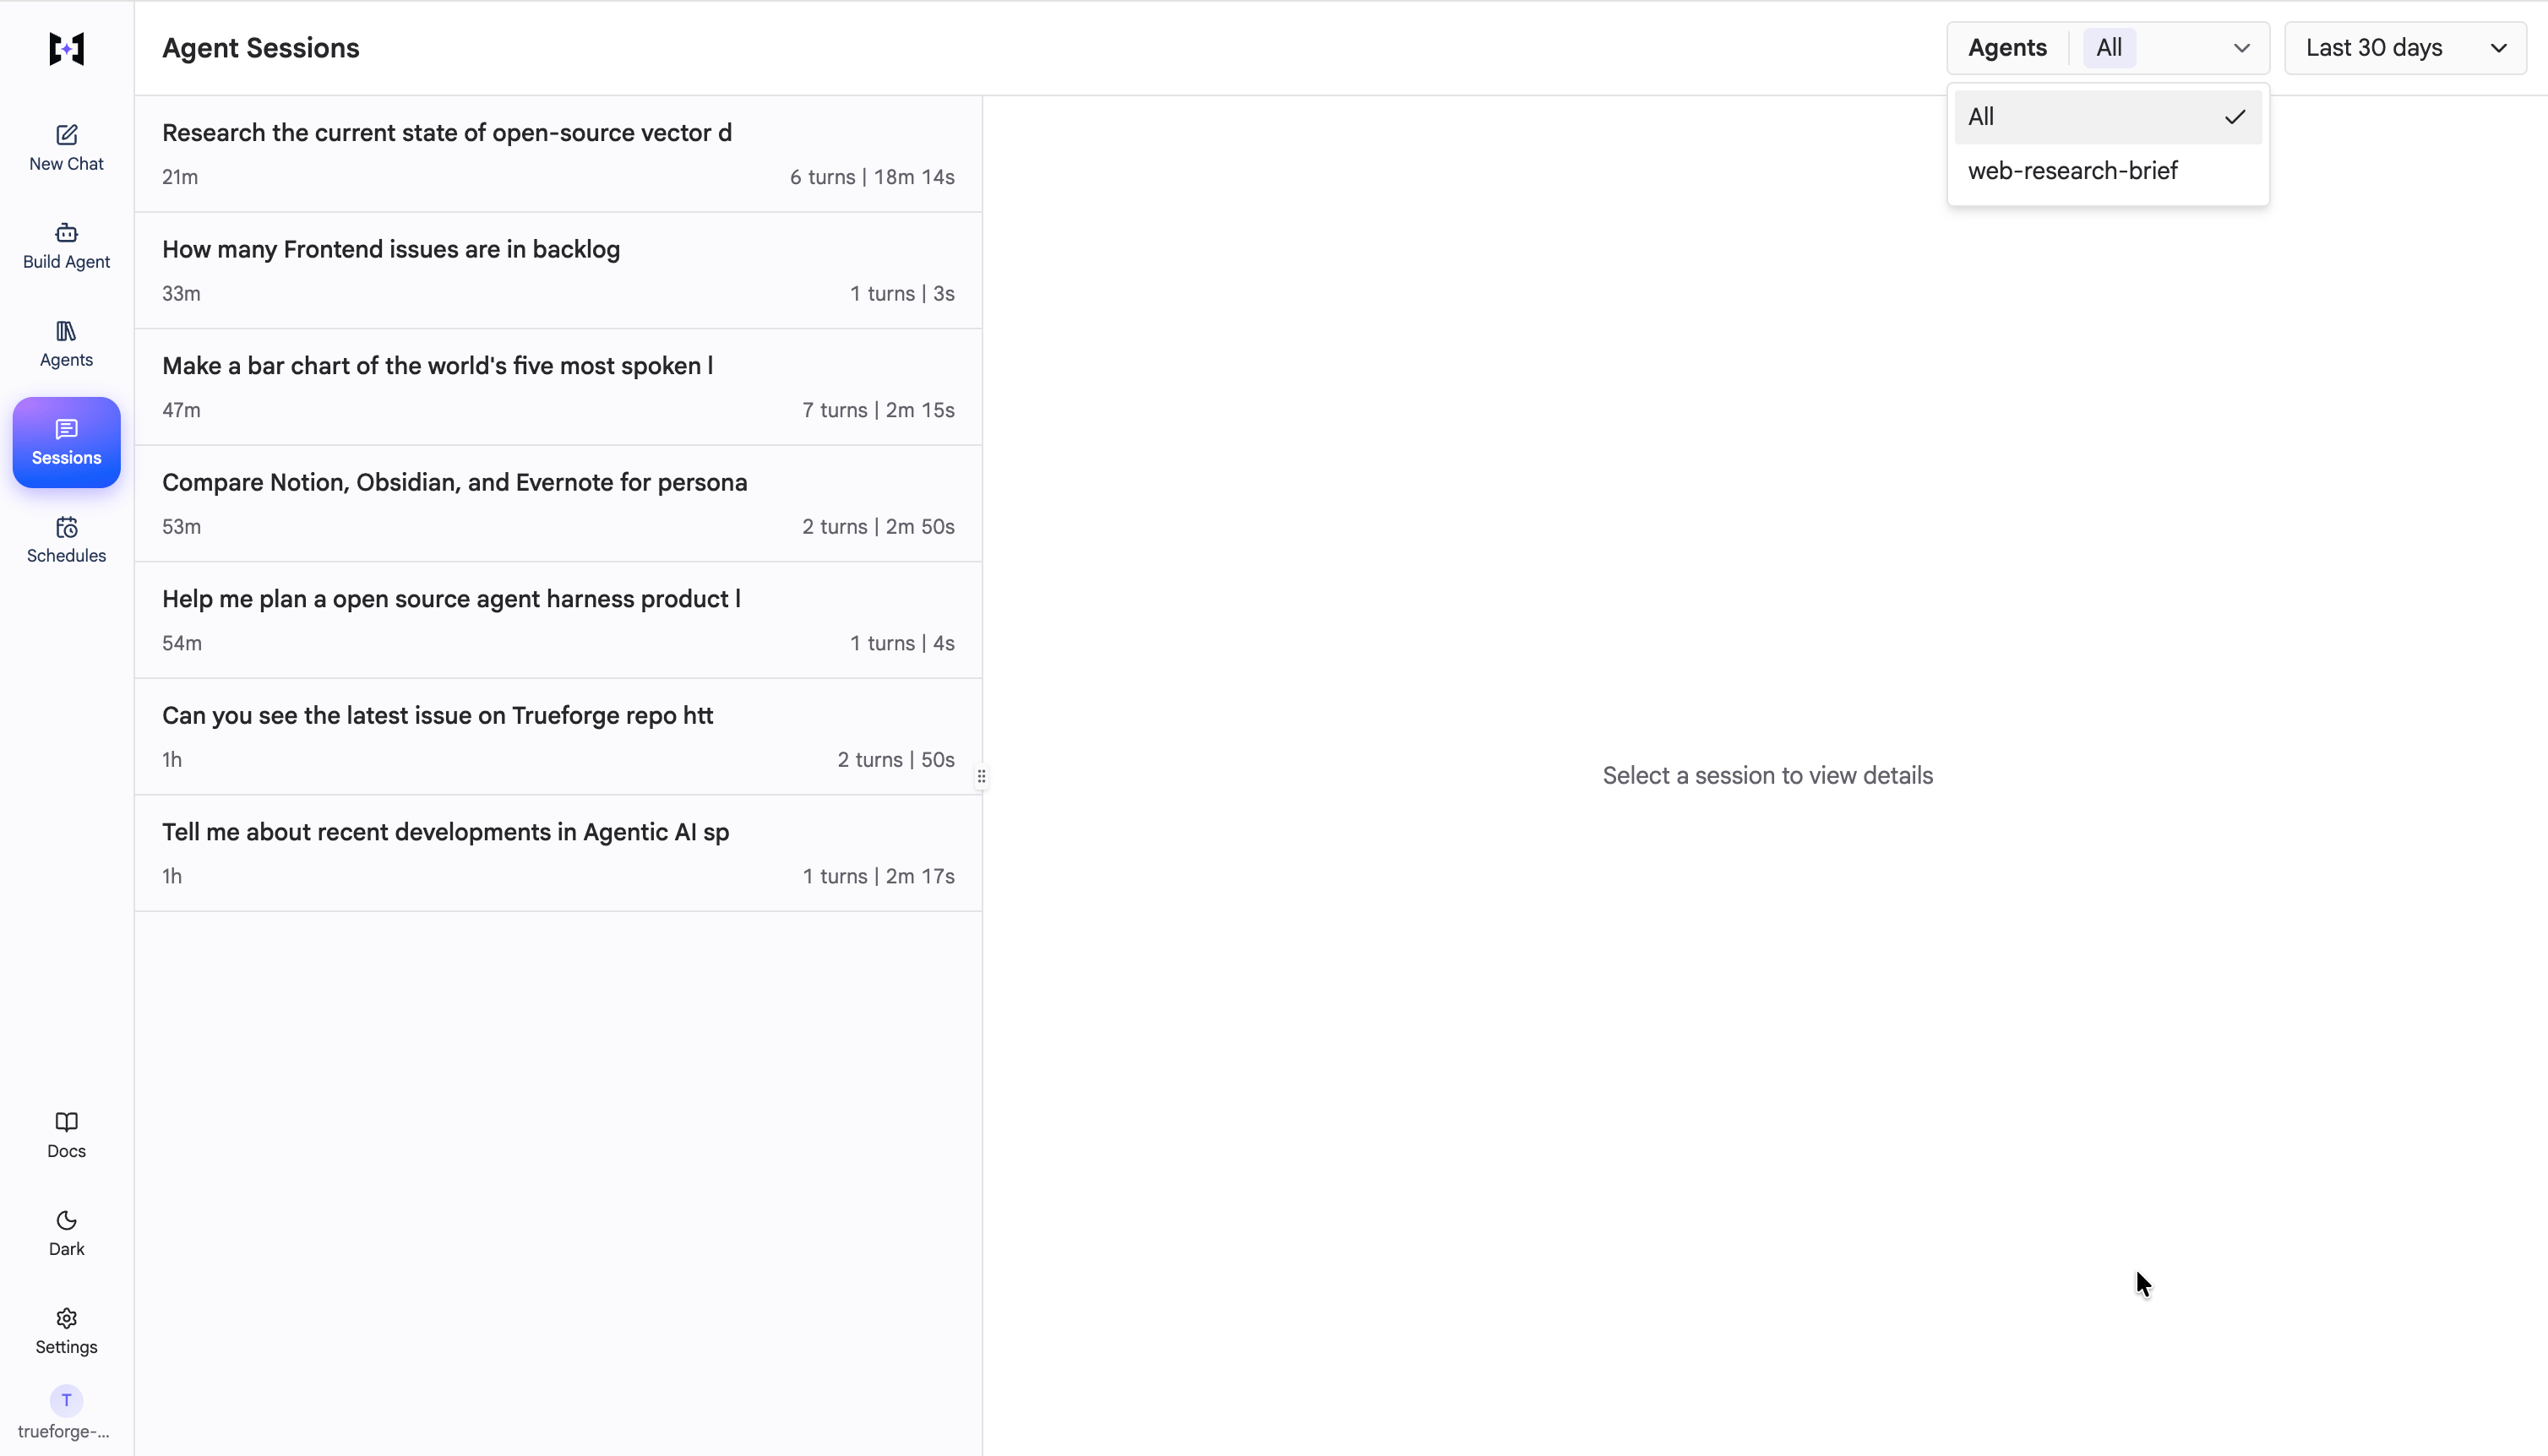
Agent Sessions: recent runs with their turn count and duration, filterable by agent and time window.
Session detail
Click a session to open it. The detail view has three parts.Summary metrics
A row of totals for the whole session: Turns, Duration, Tokens, Context, Tool calls, Sub-agents, and Errors. It summarizes the run at a glance.Event timeline
A timeline across the run, colored by event type, such as System, User, Model, Tool call, and Sub-agent. It shows how the run’s time was spent, so a slow model call, a long-running tool, or parallel subagents are easy to spot.Turn-by-turn transcript
Below the timeline, each turn is listed with its own token count and duration, the user message, and an Agent steps entry you can expand to see the tool calls the agent made and how they resolved. Together they make it easy to pinpoint where a run failed, whether a turn was cancelled, an MCP server errored, or a tool returned nothing useful.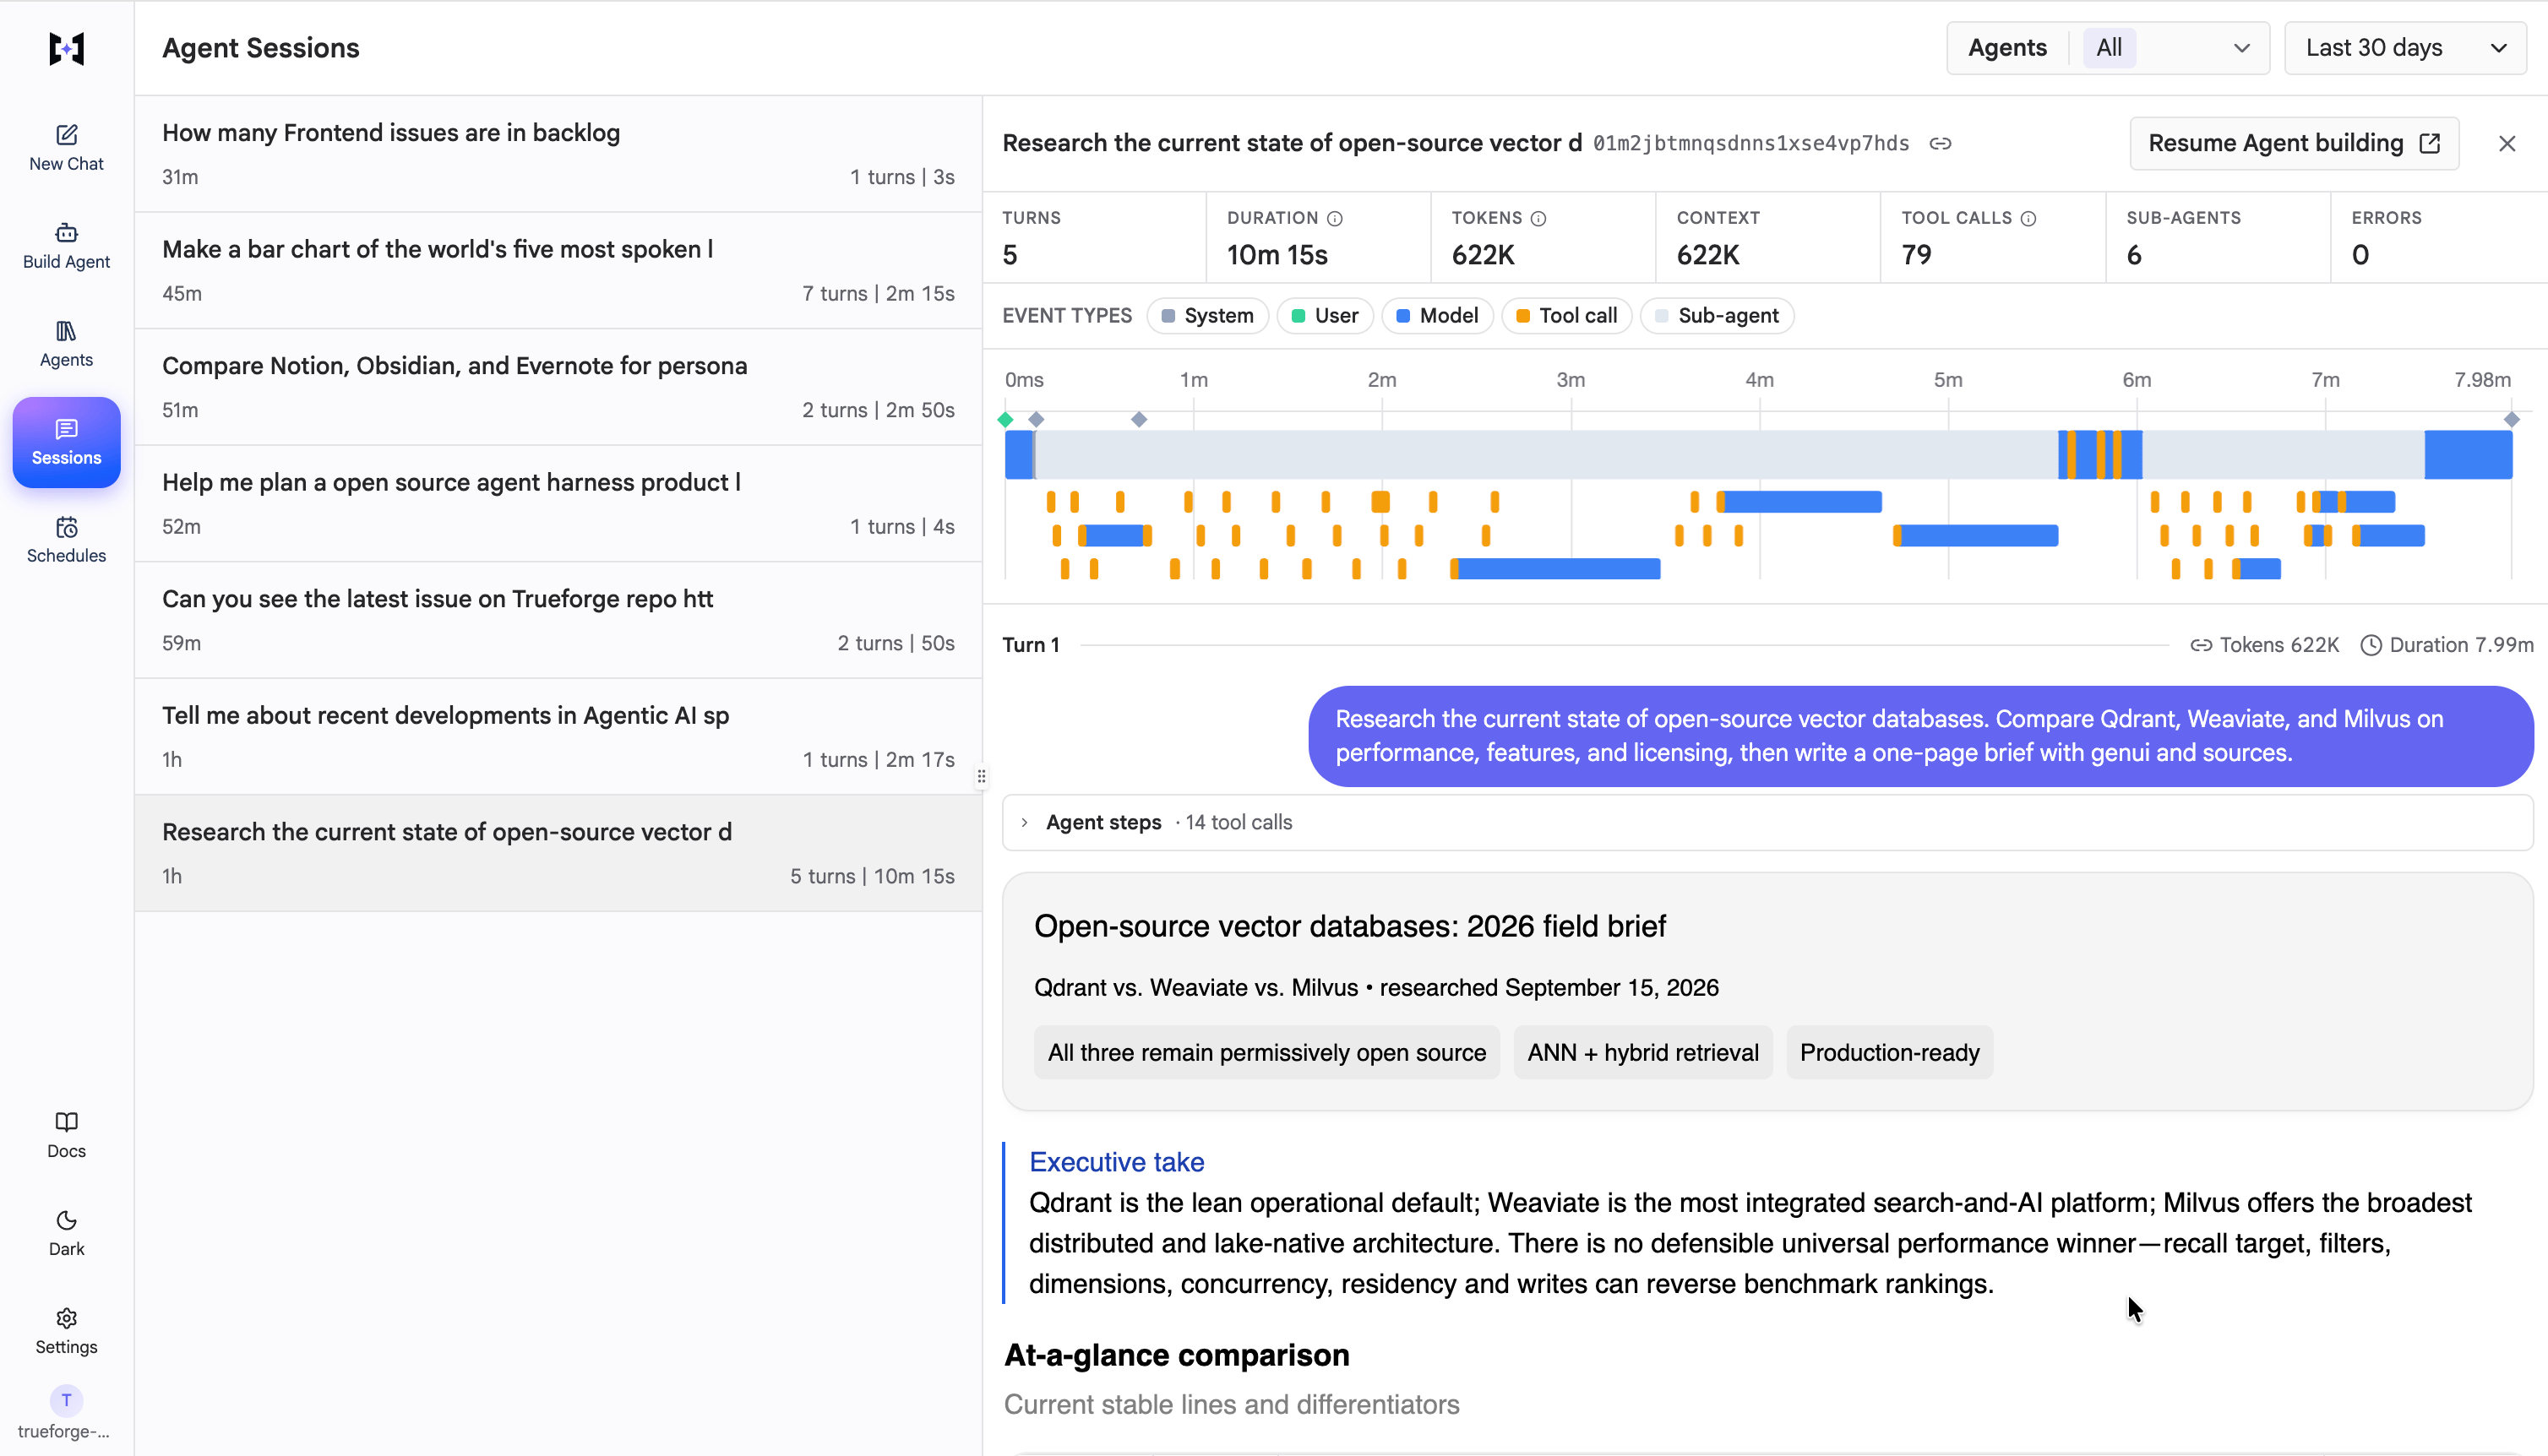
A session opened for inspection: summary metrics, the event timeline, and the turn-by-turn transcript.
Resuming a run
Each session carries a copyable session ID, and the detail header has a button to resume it, which reopens the conversation so you can continue it.In hosted mode with login enabled, session history is owner-scoped: each user sees only their own sessions. In local mode there is a single shared identity, so all sessions belong to that one user.