> ## Documentation Index
> Fetch the complete documentation index at: https://trueforge.dev/llms.txt
> Use this file to discover all available pages before exploring further.
# Sessions
> Review past agent runs: turns, tool calls, subagents, tokens, and timing.
**Sessions** records every conversation with an agent. Open it from the sidebar to see what an agent did on a run, how long each turn took, which tools and [subagents](/key-features/subagents) it used, and where something went wrong.
## The sessions list
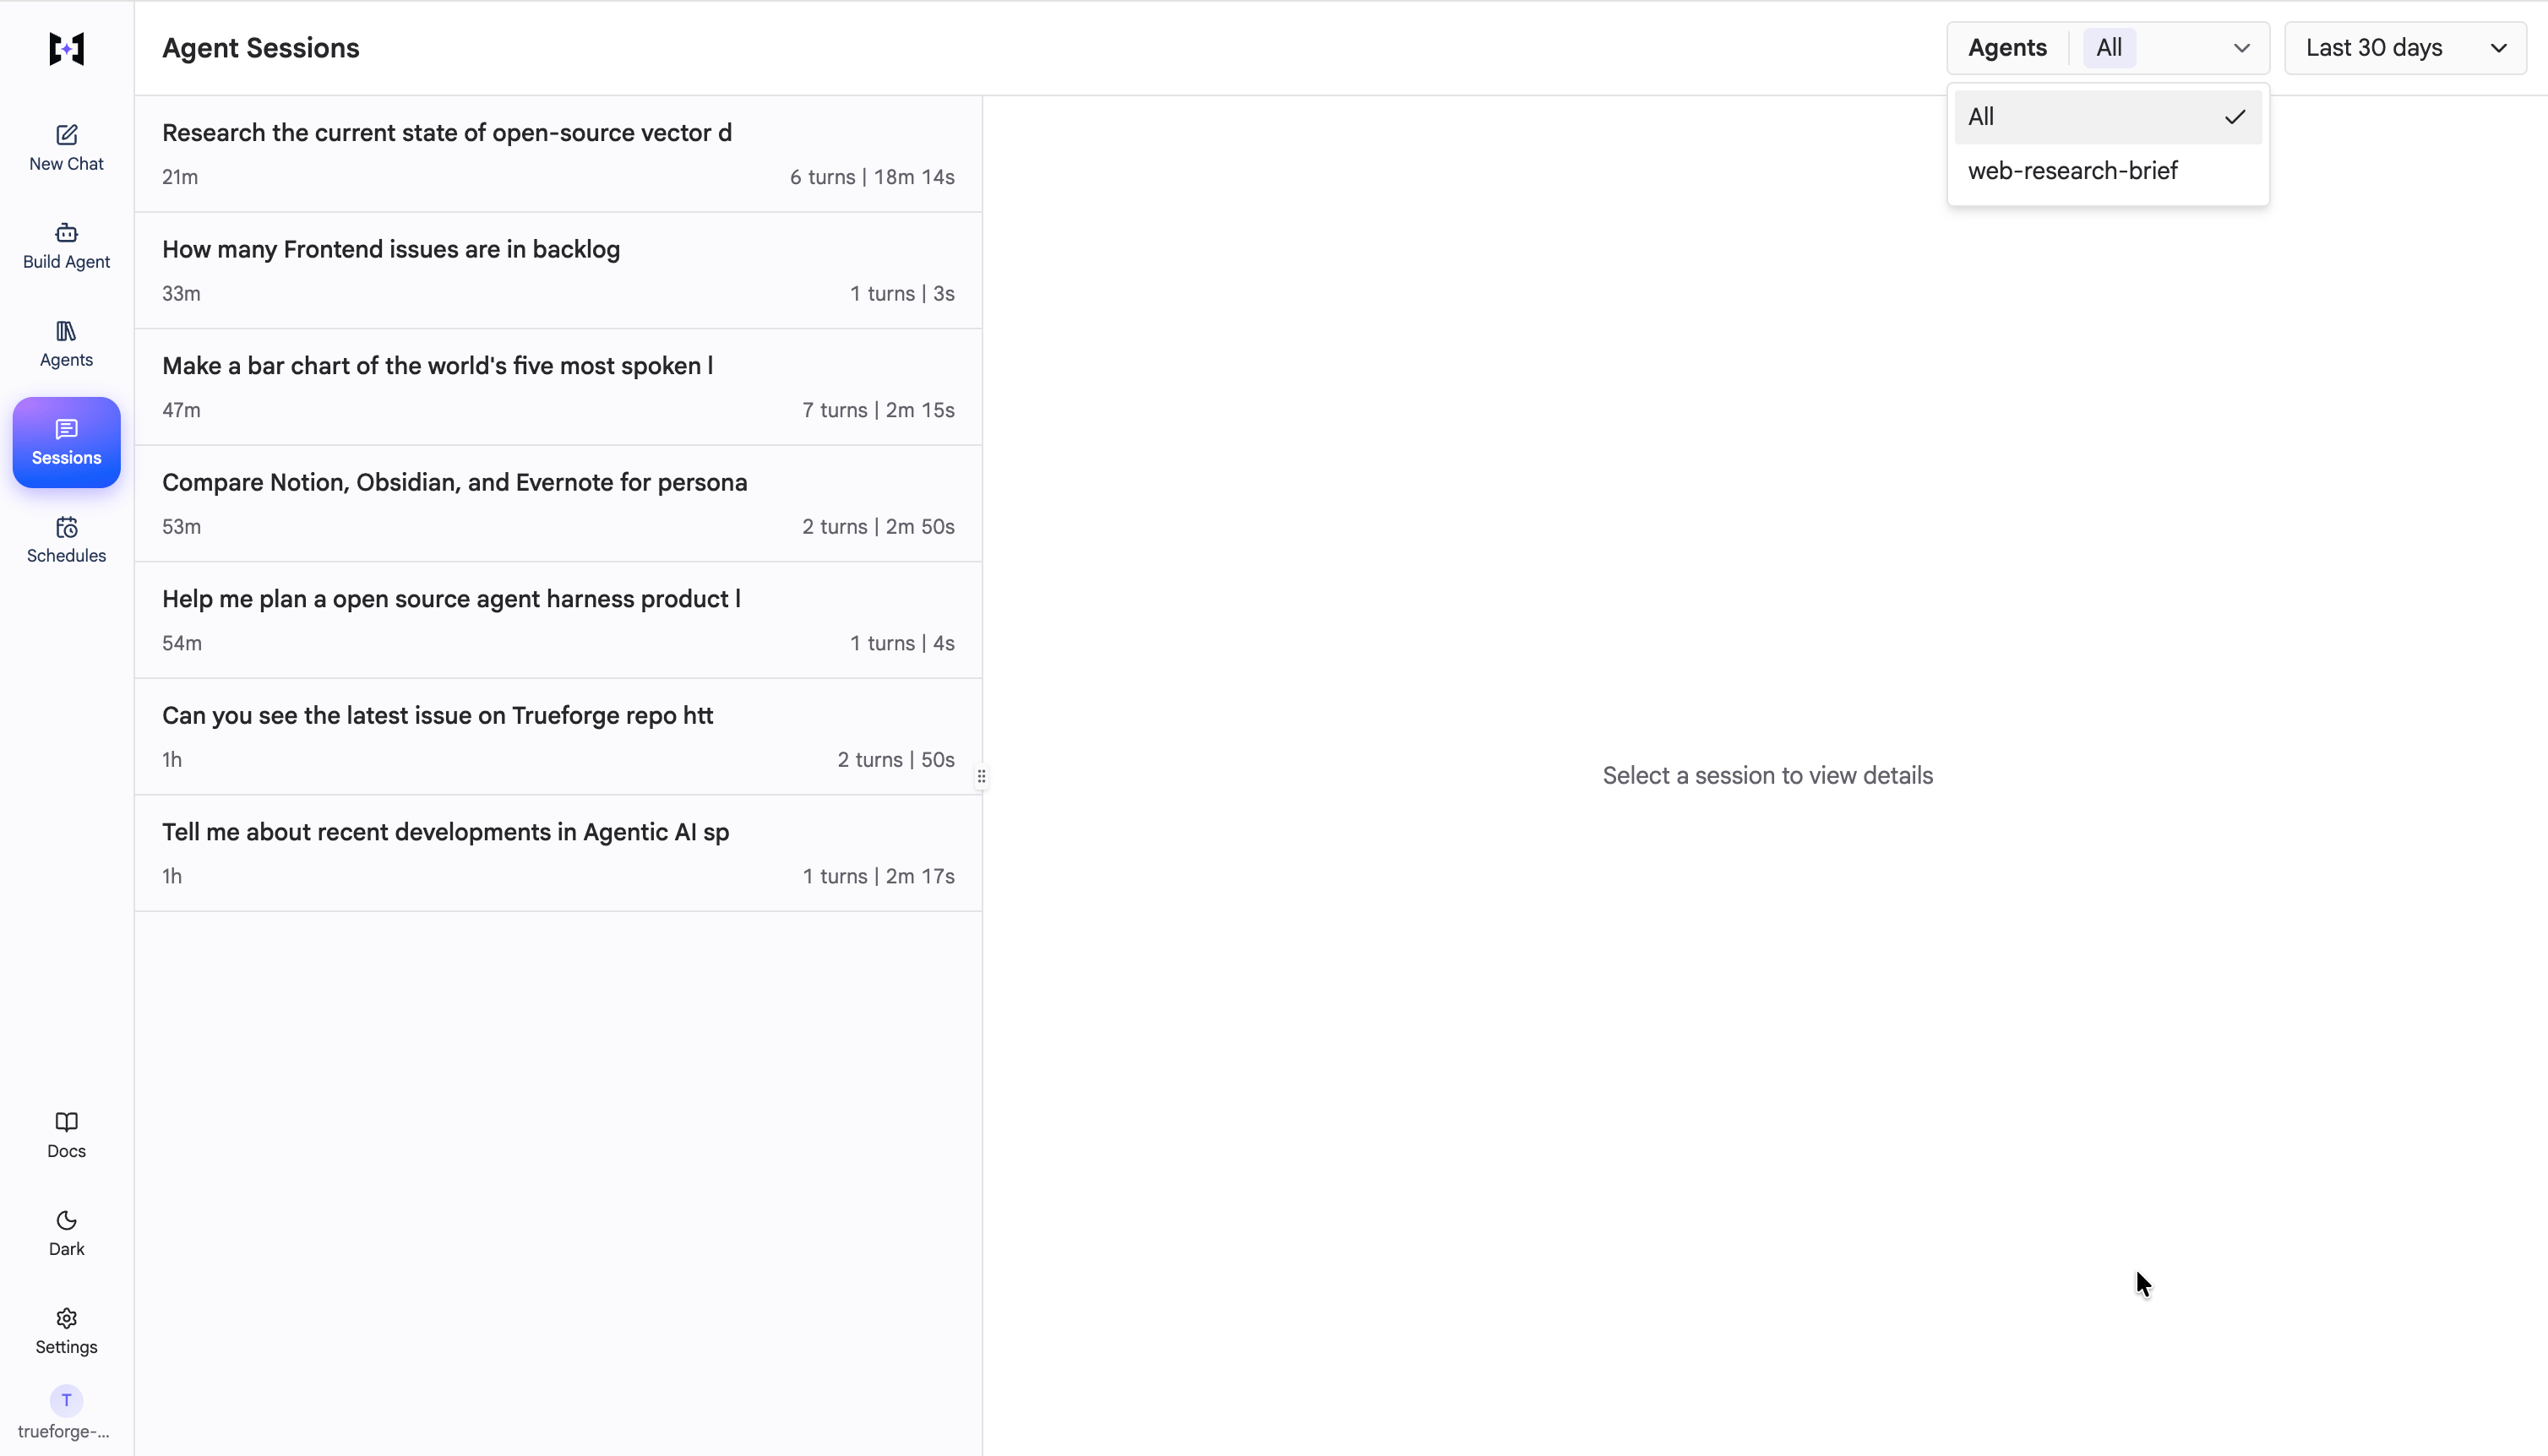
Every session is listed newest first. Each row shows the opening message, when it ran, how many turns it took, and its total duration. Use the **agent** and **time window** filters at the top (the last 30 days by default) to narrow the list to recent activity or to a single agent.
Runs started by a [schedule](/schedules) appear here too, marked **Scheduled run** and showing the agent that ran.
 ## Session detail
Click a session to open it. The detail view has three parts.
### Summary metrics
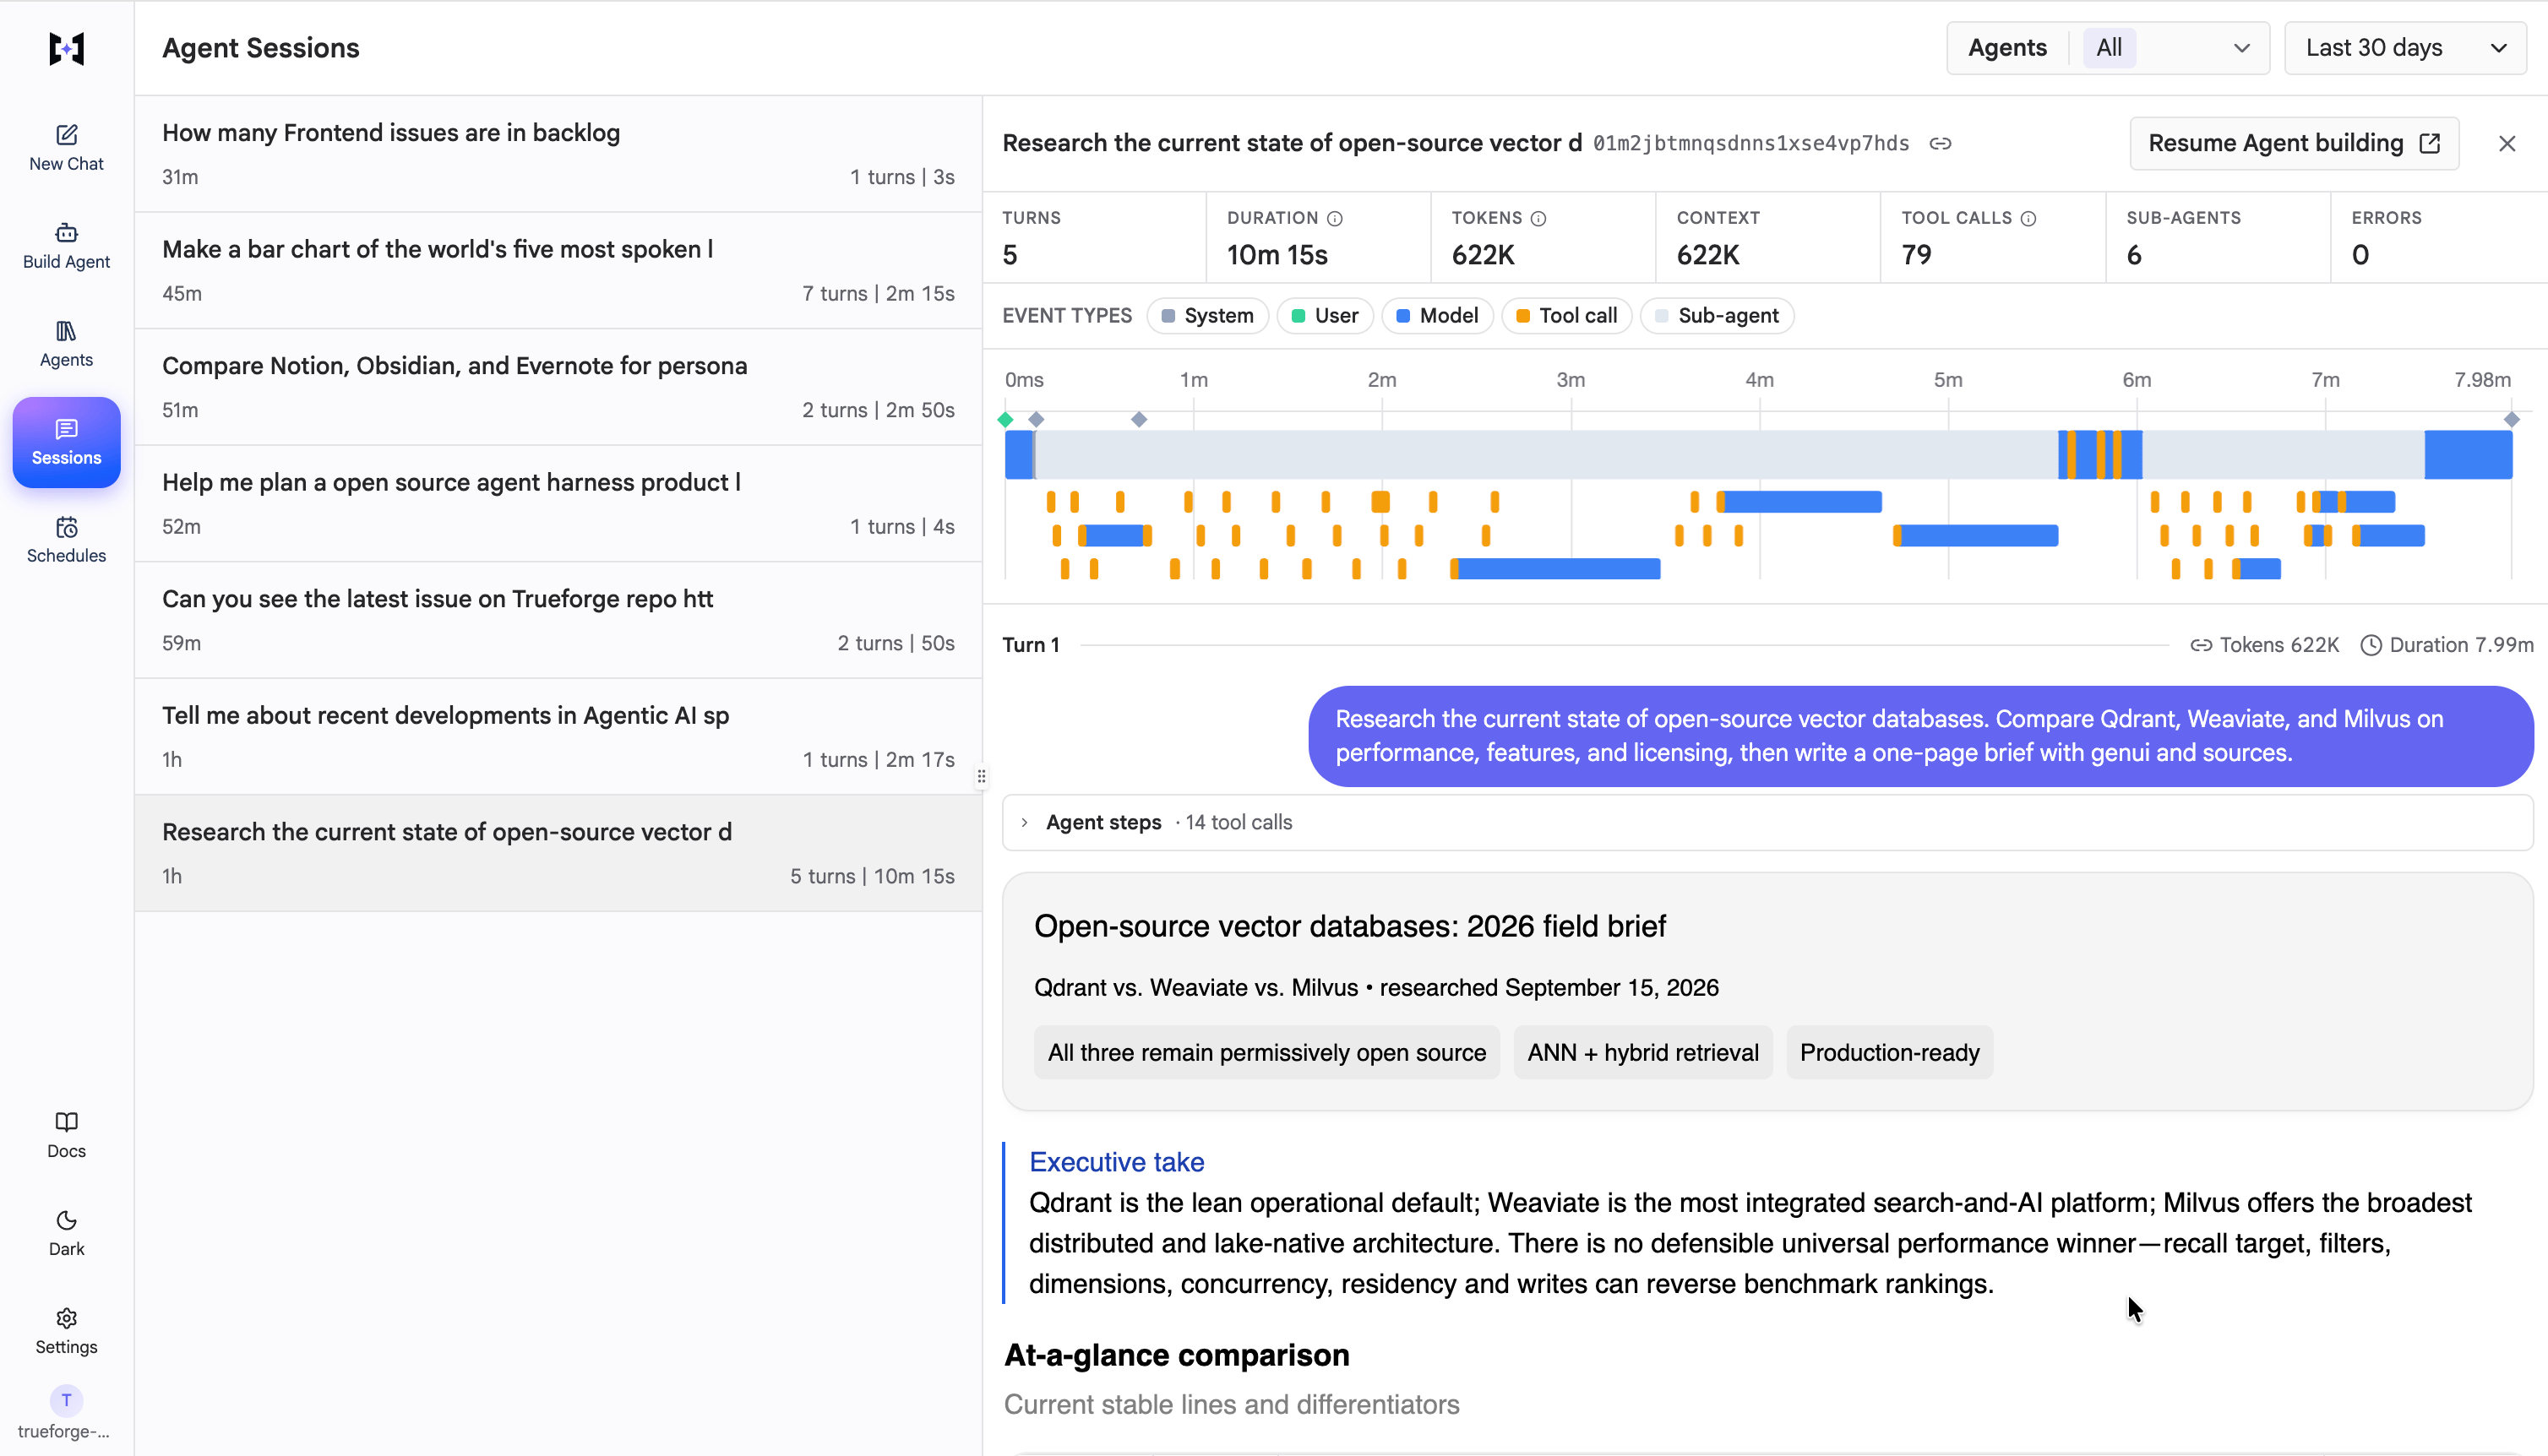
A row of totals for the whole session: **Turns**, **Duration**, **Tokens**, **Context**, **Tool calls**, **Sub-agents**, and **Errors**. It summarizes the run at a glance.
### Event timeline
A timeline across the run, colored by event type, such as **System**, **User**, **Model**, **Tool call**, and **Sub-agent**. It shows how the run's time was spent, so a slow model call, a long-running tool, or parallel subagents are easy to spot.
### Turn-by-turn transcript
Below the timeline, each turn is listed with its own token count and duration, the user message, and an **Agent steps** entry you can expand to see the tool calls the agent made and how they resolved.
Together they make it easy to pinpoint where a run failed, whether a turn was cancelled, an [MCP server](/mcp-servers) errored, or a tool returned nothing useful.
## Session detail
Click a session to open it. The detail view has three parts.
### Summary metrics
A row of totals for the whole session: **Turns**, **Duration**, **Tokens**, **Context**, **Tool calls**, **Sub-agents**, and **Errors**. It summarizes the run at a glance.
### Event timeline
A timeline across the run, colored by event type, such as **System**, **User**, **Model**, **Tool call**, and **Sub-agent**. It shows how the run's time was spent, so a slow model call, a long-running tool, or parallel subagents are easy to spot.
### Turn-by-turn transcript
Below the timeline, each turn is listed with its own token count and duration, the user message, and an **Agent steps** entry you can expand to see the tool calls the agent made and how they resolved.
Together they make it easy to pinpoint where a run failed, whether a turn was cancelled, an [MCP server](/mcp-servers) errored, or a tool returned nothing useful.
 ## Resuming a run
Each session carries a copyable **session ID**, and the detail header has a button to **resume** it, which reopens the conversation so you can continue it.
In hosted mode with [login](/authentication/overview) enabled, session history is owner-scoped: each user sees only their own sessions. In local mode there is a single shared identity, so all sessions belong to that one user.
This documentation is built and hosted on [Mintlify](https://mintlify.com), a developer documentation platform.
## Resuming a run
Each session carries a copyable **session ID**, and the detail header has a button to **resume** it, which reopens the conversation so you can continue it.
In hosted mode with [login](/authentication/overview) enabled, session history is owner-scoped: each user sees only their own sessions. In local mode there is a single shared identity, so all sessions belong to that one user.
This documentation is built and hosted on [Mintlify](https://mintlify.com), a developer documentation platform.